Share

Executive Summary
In this paper we look at the criteria for index selection in a spot bitcoin ETP, with particular focus on the timing of the index. In a recent article, CF Benchmarks have analysed the suitability of the CME CF Bitcoin Reference Rate (BRR) for the creation of regulated products and more recently performed analysis comparing this to a Sydney-based time period. We draw on that analysis in this paper and expand on it in the context of the impact on the performance, costs and market dynamics when used in a passive bitcoin ETP.
Introduction
Market indices have a broad range of use cases in financial products and investment strategies. These can be used for valuing, transacting and rebalancing of multi-asset portfolios, and have been designed to track the performance of various assets and industry sectors. In particular, these can be used to track the performance of passive investment mandates and to demonstrate the transparency of the execution process.
As a passive investment financial instrument, like most spot bitcoin ETPs, they seek to replicate the performance of the underlying bitcoin spot market measured by a specific index. The ability for an ETP issuer to maintain a low and stable tracking-error against the index is a key indicator for investors when making investment decisions to invest in ETPs. This in turn creates an incentive for asset managers to replicate the index through executing non-discretionary investment decisions via fixing orders in order to guarantee the index rate for a fee.
For markets that operate continuously, like in foreign exchange and even more so in digital assets, these indices that underpin the fixing serve as ‘closing’ prices for fund net-asset value (NAV) valuation. Consequently, with the growing issuance of passive ETPs globally, the selection criteria of an appropriate index creates challenges with regard to its timing and the impact that has on the liquidity available as representative of the underlying assets that make up the ETP index. These challenges are further exacerbated when focusing on digital assets given the nascent asset class and relative low liquidity.
The Monochrome spot bitcoin ETP will leverage the widely regarded index provider, CF Benchmarks, specifically the BRR. The BRR is a once-a-day benchmark index price for bitcoin denominated in US Dollars published at 4pm London local time. Input data is obtained from major cryptocurrency exchanges or marketplaces that conform to the CME CF Constituent Exchange Criteria. Calculated every day since its launch on 14th November 2016, the BRR is a highly trusted source of bitcoin pricing and the pre-eminent price benchmark for bitcoin risk settlement being a Registered Benchmark under the European Union’s Benchmark Regulation regime (EU BMR). Furthermore, the BRR is the settlement index for bitcoin futures and options contracts listed by CME Group and the Crypto Facilities MTF, as well as being the pricing source for NAV/iNAV determinations for regulated investment products offered by major financial institutions globally.
A major factor that differentiates the BRR to other bitcoin indices is the large liquidity complex (see Figure 1) and market participant ecosystem that has evolved around its use in institutional products. This is evidenced by the fact that the BRR is used as the bitcoin futures and micro futures settlement price on the Chicago Mercantile Exchange (CME), attracting the development of more institutional products and institutional liquidity, some of which already have experienced significant market growth since launch. In addition to this, the BRR also serves as the daily settlement price for CME Bitcoin BTIC orders (Basis Trade at Index Close) which are available 24h during weekdays. Finally, the rise of OTC derivatives, like non-deliverable forwards (NDFs) and non-deliverable options (NDOs), has provided indirect access to digital assets to traditional market participants that otherwise are unable to trade in the underlying digital assets. The fixing index of choice for these OTC derivatives is the range of CF Benchmark digital asset indices. This institutional grade liquidity and tools serve as an effective approach to manage the market risk from creation/redemption orders and reduce the tracking error of ETPs that leverage this particular index. Given this market ecosystem around the BRR, digital asset OTC providers also offer execution services (fixings) to guarantee fills at the BRR for a fee.
This liquidity complex does not exist with any other digital asset indexes or in other time zone. Lower activity levels seen during other time periods throughout the day typically suffer from low liquidity, and are prone to larger market impact and to manipulation and signalling risk from flows in and out of the issuance of global ETP products.
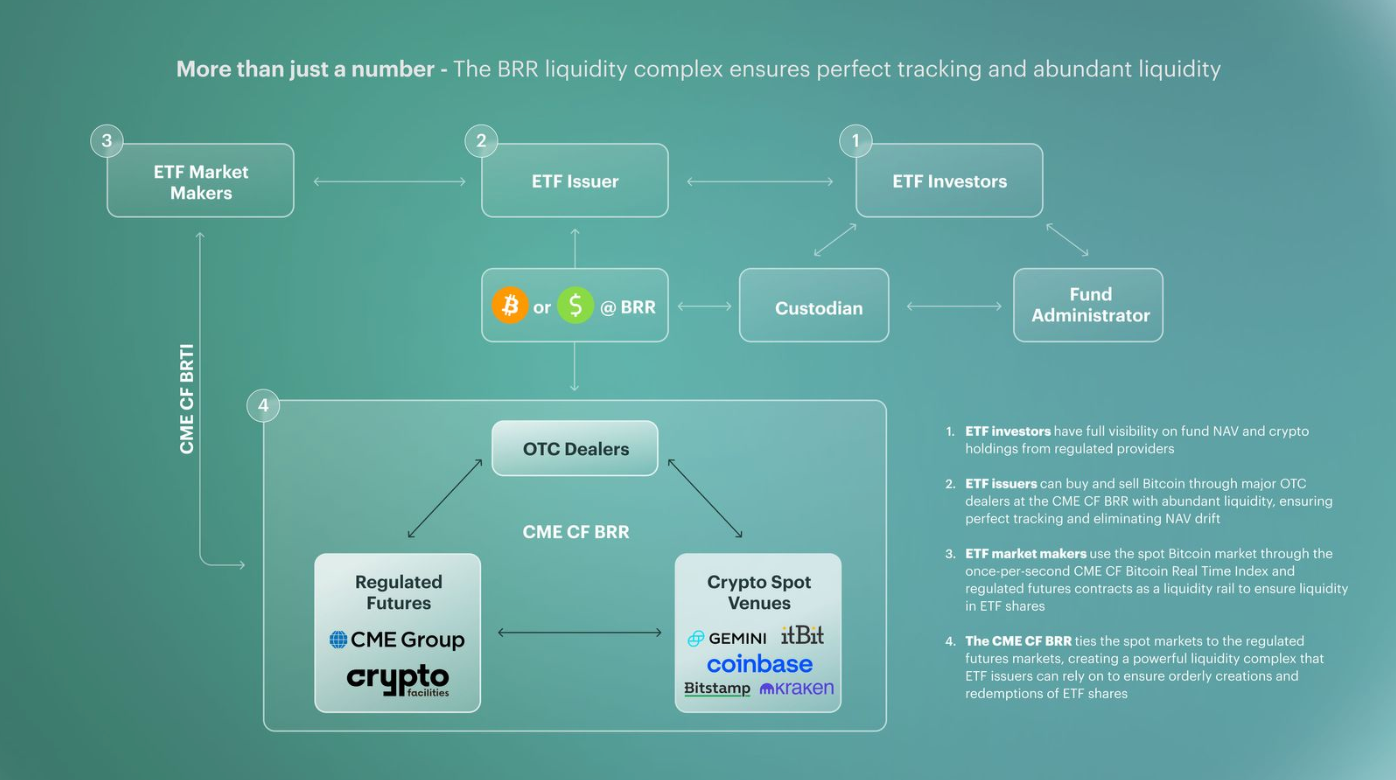
Figure 1- CME BRR liquidiy complex (Source: CF Benchmarks).
Key Factors in Benchmark Selection with Respect to Timing
Representative of Investment Strategy Goal
For a passive bitcoin ETP, the investment goal is to closely track the underlying spot bitcoin market by leveraging a valuation index that reflects a substantial proportion of the trading activity and liquidity. As seen in Figure 2, the average activity measured during the Sydney ‘close’ completely excludes the majority of the activity in the trading day ahead. Furthermore, Figure 3 demonstrates that throughout the events of 2021, namely after speculation of greater government regulation, flipping of Greyscale premium to discount and China’s ban on bitcoin services, that liquidity had shifted away from Asia to the Americas time zone. More specifically, the data shows volumes executed in the first half of the trading day dropped from 42% to 35% of the total trading volume activity in the last 5 quarters.
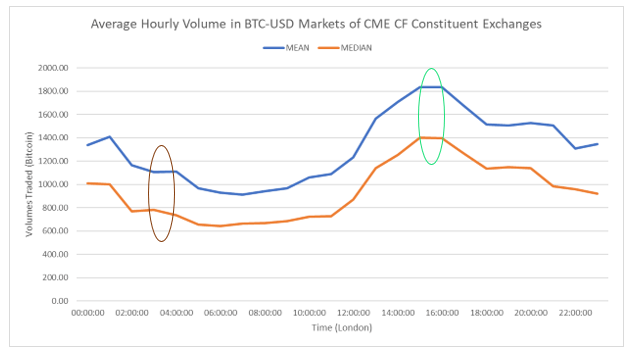
Figure 2- Hourly traded volume profile (Source: CF Benchmarks).
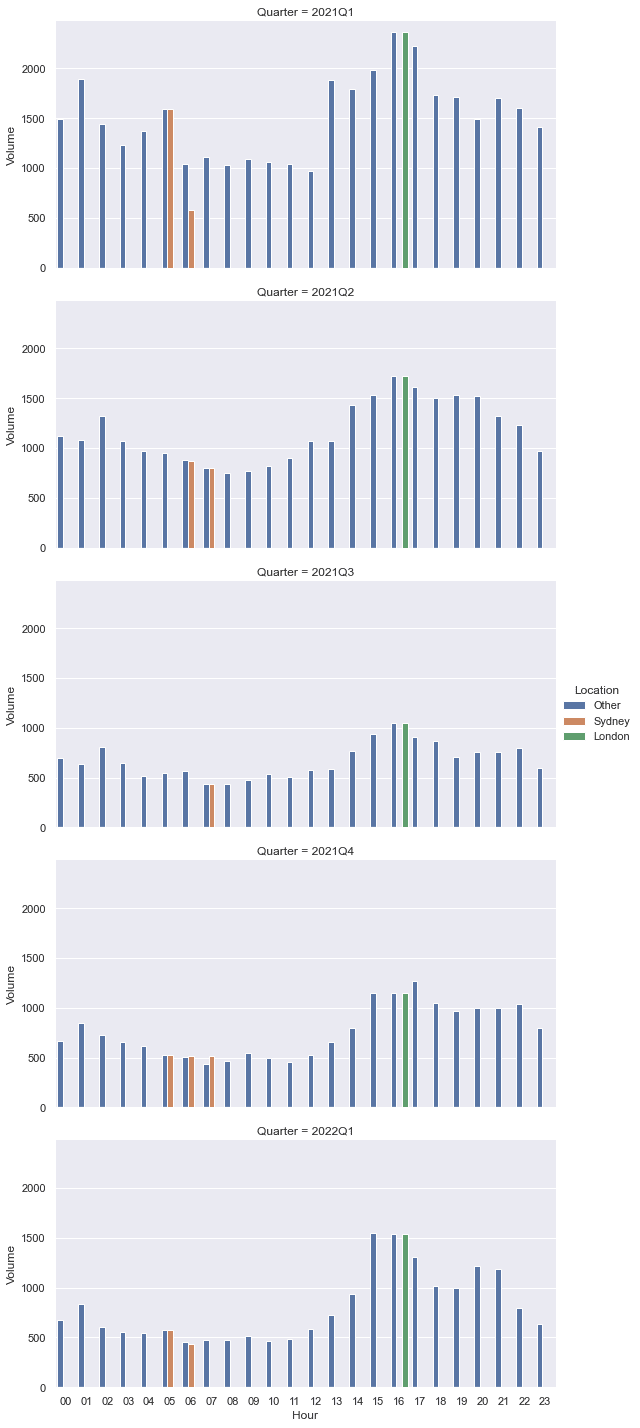
Figure 3 - Evolution of hourly trading volume profile over the last five quarters. X-axis hours represented in London local time. (Source: Monochrome). Sydney close time represented by London time varies in the hour of the day due to changes in daylight savings clock adjustments.
Finally, Figure 4 illustrates that the volumes executed during the ‘close’ window of 3-4pm in Sydney are about half or less of the volumes executed during the same hour in London.
In the analysis performed by CF Benchmarks, the paper goes on to demonstrate how price pairwise correlation between different constituent exchanges breaks down during the Sydney ‘close’ in contrast to the strong price correlation during the London ‘close’.
In summary, the trend in observations made in the reduction of activity and divergent correlation between prices from constituent exchanges in the Sydney time zone versus the London time zone may lead to the construction of an unrepresentative benchmark at or around the Sydney ‘close’ that could harm investors.
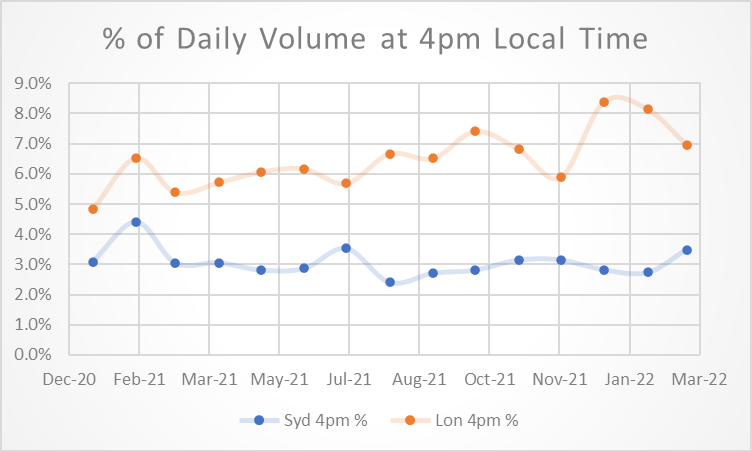
Figure 4- Percentage of daily volume executed at 4pm London and Sydney time from major constituent exchanges (Source: Monochrome Asset Management).
Investable and Replicable
Going beyond the key factor of Representation, are the notions of Investable and Replicable which refer to the ability to implement an investment strategy, with appropriate access to liquidity, that can closely track the benchmark.
One can immediately draw the conclusion around the price correlation point made in the previous section, where potentially disparate marketplace prices would require investment managers to directly or indirectly have access to more venues and data to closely replicate the index.
Furthermore, CF Benchmarks’ analysis goes on to simulate the purchase of bitcoins without breaching a specific slippage threshold. Despite the nature of the experiment, which does not represent how execution algorithms consume liquidity, the analysis shows how investors would incur increased costs due to the higher slippage occurring during the Sydney ‘close’. The analysis also points out that on certain days there was insufficient liquidity to purchase a reasonable institutional parcel size of 50 bitcoins during the Sydney ‘close’, further demonstrating the lack of liquidity available at this time to access and replicate an index.
Designed to be Resistant to Market Manipulation
The integrity of the constituent exchanges plays a vital role in the construction of any market index. Adequate disclosure and due diligence is required, alongside independent and transparent auditing of the processes in place to ensure fair, transparent market places that are free of manipulation, are selected as constituent exchanges. This exchange oversight should adhere to benchmarking regulations and standards such as IOSCO and EU BMR.
To further enhance the resistance to manipulation through the oversight function, the benchmark calculation methodology should be designed with rules to reduce potential market manipulation systematically. These typically require filtering and aggregation techniques applied on the data obtained from the constituent exchanges to remove outliers.
The size of the calculation window and the number of constituent exchanges employed also plays an important role, in particular for illiquid markets, when it comes to designing a manipulation resistant index. A small window, and a small set of constituent exchanges would create an ecosystem where activity is concentrated in a small duration of time causing potentially significant market impact and signalling risk. This has been experienced in FX with manipulation allegations around the common WMR benchmark, and hence the appearance of alternative solutions (Raidne Siren benchmark, for instance) looking to address the underlying methodology concerns by increasing the calculation window and introducing more constituent venues. Also, QIC performed research into the ‘illusionary benefits’ of trading at the WMR fix, highlighting insights into the market impact created by the concentration of flows during this small window, resulting in potentially material costs to investors and falling short of ‘best execution’ requirements.
The added complexity of identifying and vetting marketplaces or exchanges in crypto assets to the level required by regulation, paired with significant time zone differences in activity and liquidity, points to the early stages of this asset class and the limited choice of robust benchmarking.
Tolerance for Tracking Error Difference and Volatility
As an investor trading in a secondary ETP market, you want the valuation of your investment to reflect the underlying price index as closely as possible. In the primary market, Authorised Participants (AP) require the ability to create and redeem exposure to the ETP asset constituents, in this case bitcoin, at the NAV. The tracking error is the difference between the NAV and the index returns and is typically negative due to the impact of costs. This tracking error can fluctuate significantly if the asset manager or AP is unable to effectively execute at the index price. Having the liquidity complex and tools for mitigating this risk, as is available around the 4pm London BRR, reduces the effect of transaction costs in the tracking error.
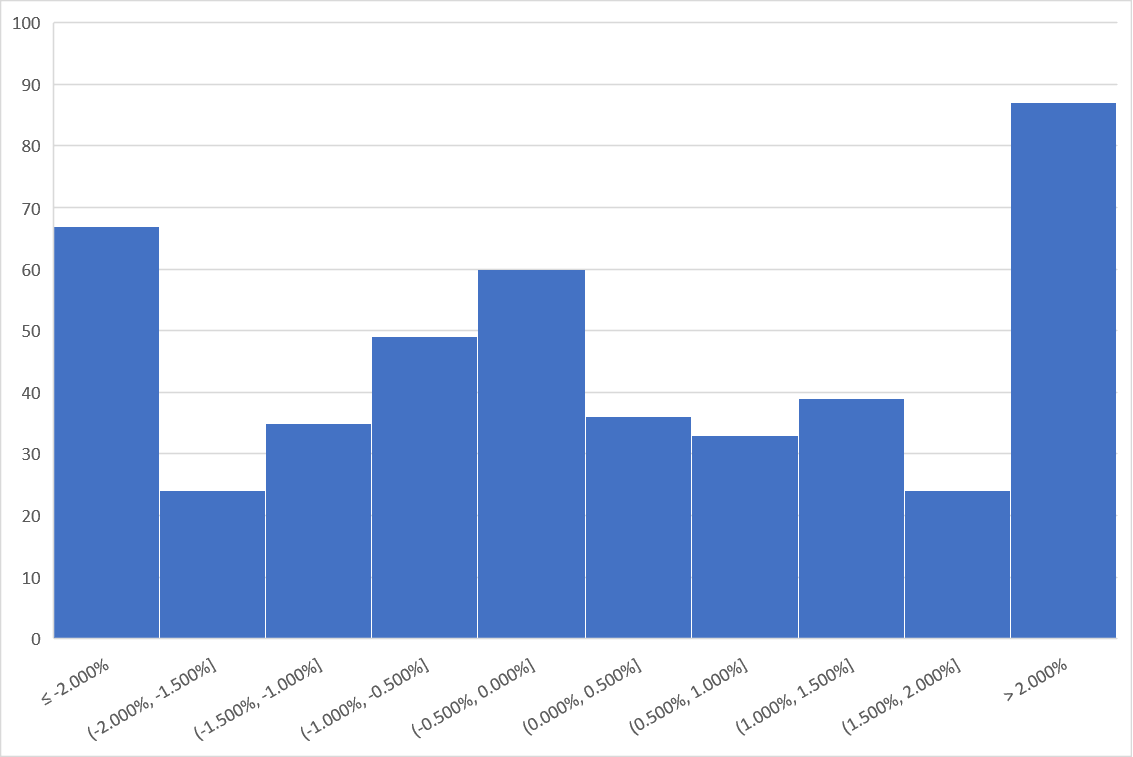
Figure 5 - Log-return difference between Sydney and London prices. (Source: Monochrome Asset Management).
Figure 5 illustrates the intraday bitcoin price variability between the Sydney and the London ‘close’. Given the volatility of this asset, it is no surprise to see frequent tails of +/- 2% moves intraday which would impact investor entry levels into a fund and therefore expected performance.
References to Regulation
In October 2021, the ASIC published Information Sheet 230 (INFO 230), providing guidelines and good practices for licensed Australian exchanges to admit exchange trade products (ETPs), including exchange traded funds (ETFs), structured products and certain managed funds. In particular, it referenced crypto-assets as being permissible underlying assets for listed ETPs.
ASIC’s INFO 230 also covers challenges with respect to pricing crypto-assets. ASIC considers it good practice for market operators to verify that the benchmark or index price is published by a widely regarded provider and that it reflects a substantial proportion of the trading activity in the underlying in a representative and unbiased manner. Furthermore, the index must be designed to be resistant to manipulation and complies with recognised benchmark principles such as IOSCO and EU BMR.
CF Benchmarks has previously published articles, which illustrate similarity in the terminology used within their policy or methodology documents when compared to the guidelines published by ASIC.
When looking specifically at the EU BMR, there is a particular requirement for benchmark administrators to employ a methodology that is resilient and ensures that the benchmark can be calculated in the widest set of possible circumstances, without compromising its integrity. Also, when developing a benchmark methodology, a benchmark administrator should take into account factors including the size and normal liquidity of the market, the transparency of trading and the positions of market participants, market concentration, market dynamics, and the adequacy of any sample to represent the market or economic reality that the benchmark is intended to measure. This supports the view of leveraging a benchmark or index that is calculated during a time period which is representative of the bitcoin trading activity like the BRR.
Conclusion
In this short paper, we looked at the key factors when designing benchmarks and specifically how the bitcoin market dynamics throughout the trading day impacted them.
The bitcoin market exhibits higher volumes and trading activity during European and Americas trading hours. As seen with other asset classes, this has led to the creation of indices that reference activity during these time zones. The size of the calculation window, number of constituent venues, filtering and aggregation of data play an important role in creating a manipulation resistance index.
Furthermore, the liquidity complex available around the CME BRR benchmark at 4pm London local time has attracted significant institutional liquidity and regulated product development, including globally issued bitcoin ETPs. In turn, the liquidity and risk-management tools available in the BRR market ecosystem allow for near-perfect tracking of the reference rate providing lower costs for product providers and their clients.
The content, presentations and discussion topics covered in this material are intended for licensed financial advisers and institutional clients only and are not intended for use by retail clients. No representation, warranty or undertaking is given or made in relation to the accuracy or completeness of the information presented. Except for any liability which cannot be excluded, Monochrome, its directors, officers, employees and agents disclaim all liability for any error or inaccuracy in this material or any loss or damage suffered by any person as a consequence of relying upon it. Monochrome advises that the views expressed in this material are not necessarily those of Monochrome or of any organisation Monochrome is associated with. Monochrome does not purport to provide legal or other expert advice in this material and if any such advice is required, you should obtain the services of a suitably qualified professional.

Monochrome Asset Management
Related Articles


Your Complete Guide to the Australian Bitcoin ETFs Functionality
This comparison breaks down two game-changing features: bitcoin deposit and withdrawal flexibility (can you actually move Bitcoin in and out of the ETF?) and fund structure (do you truly own the Bitcoin?). These distinctions might seem technical, but they have real implications for your investment strategy, tax treatment, SMSF reporting, and long-term flexibility.